MARKET STATISTICS

MARKET STATISTICS
MARKET STATISTICS

2022 Endyear Unemployment Rates

As of November 2022, the Bureau of Labor Statistics states the unemployment rate for the Toledo MSA is 3.4%, down from 3.5% at mid-year 2022. Ohio’s overall unemployment rate saw an increase. The U.S. unemployment rate of 3.5% grew from 3.4% at mid-year 2022


MARKET STATISTICS
MARKET STATISTICS

Vacancy/Net Absorption

The bulk of the space absorbed in 2022 took place in the Perrys- burg/Northwood submarket, though all submarkets recorded positive net absorption for the year. The overall market vacancy rate increased in the second half of the year and from year-end 2021. The increase largely occurred in the Perrysburg/North- wood submarket is almost entirely attributable to the Peloton facility being delivered vacant.


stats-5
MARKET STATISTICS

Average Asking Lease Rate

The average asking rental rate stood at $4.58 per square foot at year-end 2022 a solid increase over mid-year and the end of 2021. The average asking rental rate in the North Toledo sub- market registered the largest jump, increasing $1.52 per square foot in the second half of 2022. The average asking rental rate for Class A buildings reached $6.85 per square foot.


MARKET STATISTICS
MARKET STATISTICS

New Construction

2,761,000 square feet of space was under construction at year end 2022 following delivery of 3,405,186 square feet of space in the second half of 2022.


TOP TRANSACTIONS

For more information regarding the MarketView, please contact:

Harlan Reichle, CCIM, SIOR
President & CEO Reichle | Klein Group
One SeaGate,Toledo, OH 43604
419.794.1122 t      419.794.6060 f
hreichle@rkgcommercial.com

© Copyright 2021 Reichle | Klein Group. Information contained herein, including projections, has been obtained from sources believed to be reliable. While we do not doubt its accuracy, we have not verified it and make no guarantee, warranty or representation about it. It is your responsibility to confirm independently its accuracy and completeness. This information is presented exclusively for use by Reichle | Klein Group clients and professionals and all rights to the material are reserved and cannot be reproduced without prior written permission.

SUBMARKET MAP

GLOSSARY OF TERMS

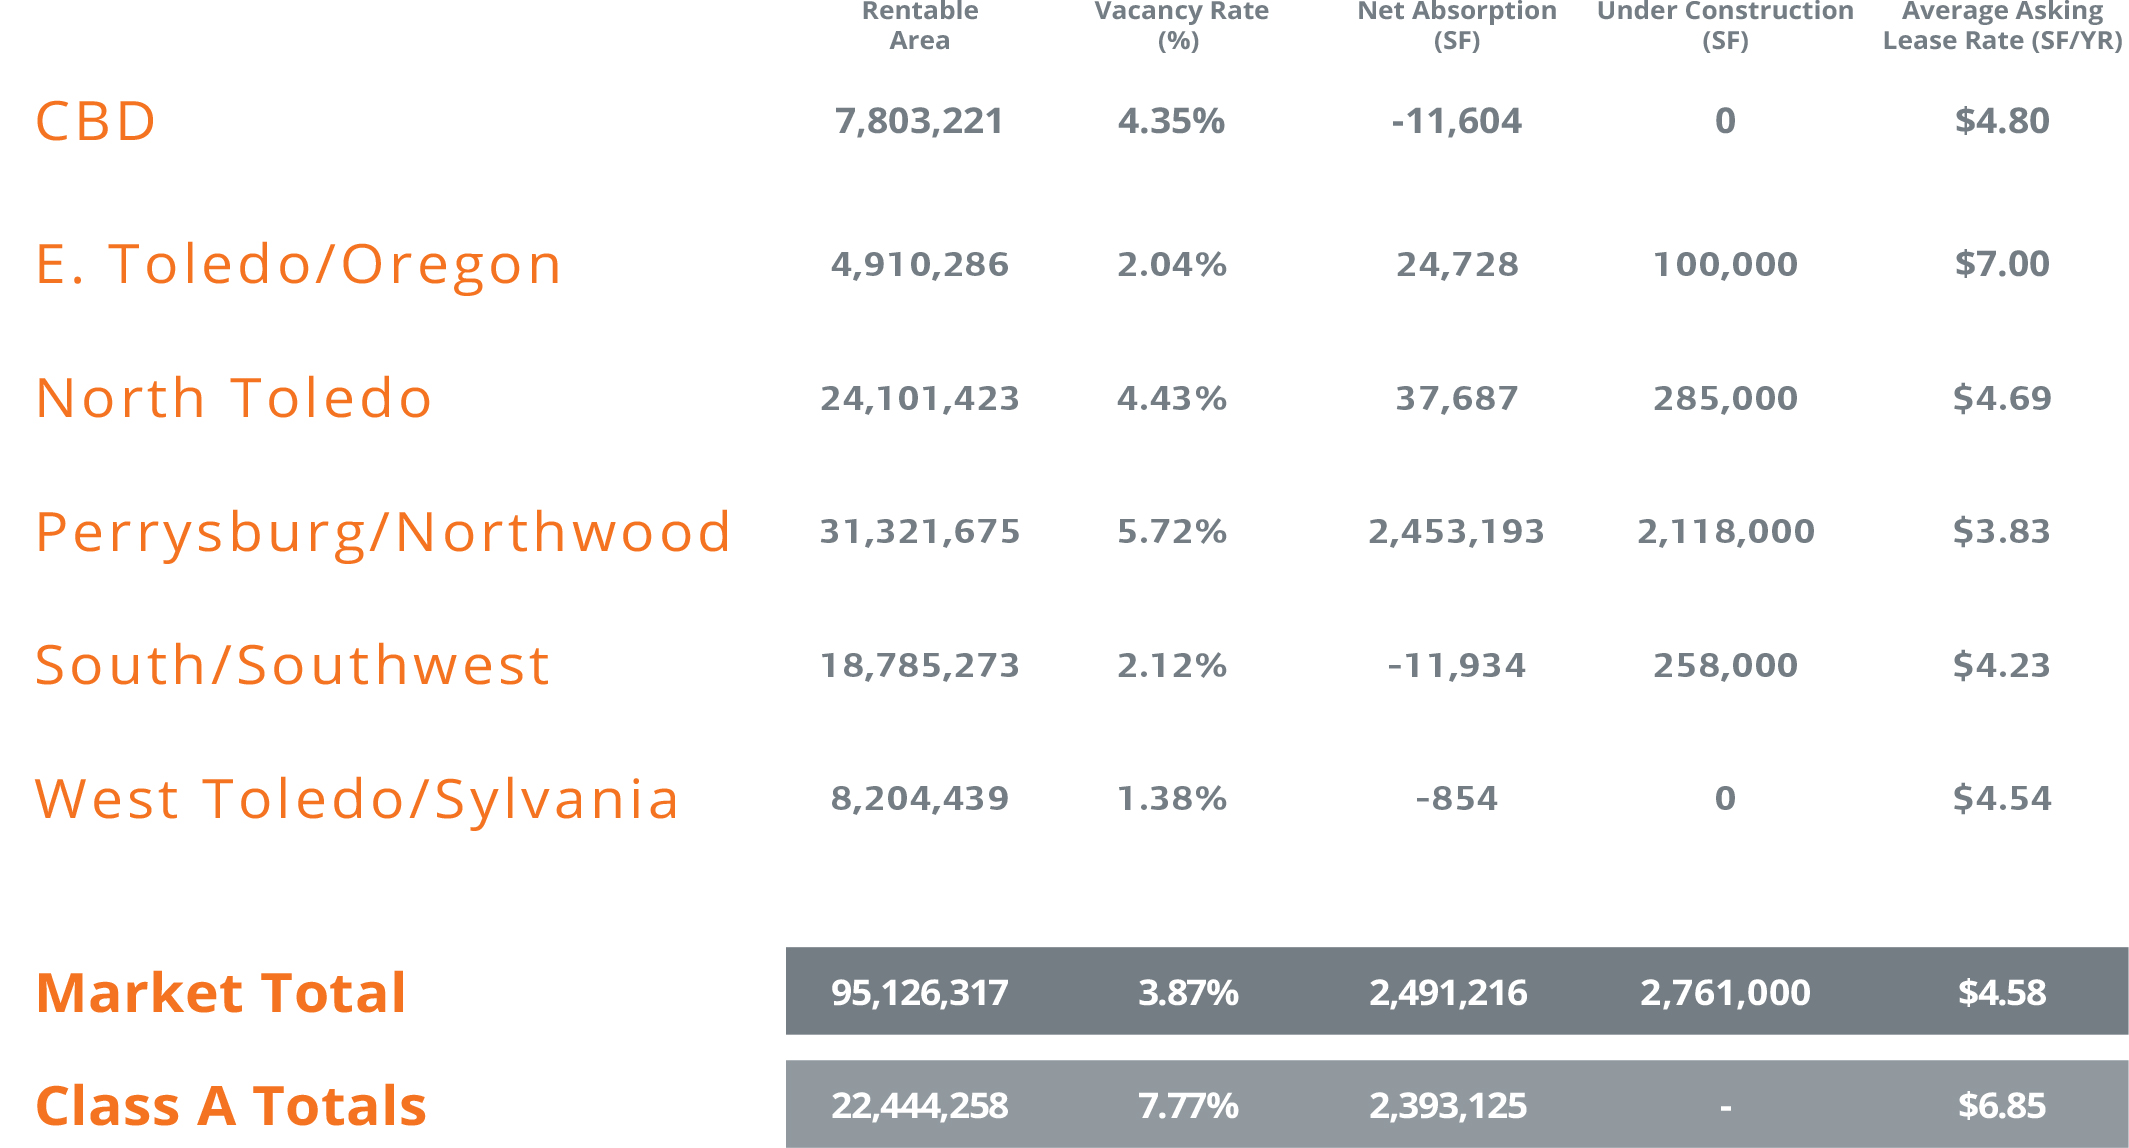
Average Asking Lease Rate: Rate is determined by multiplying the asking net lease rate for each building by its available space, summing the products, then dividing by the sum of the available space with full-service gross leases for all buildings in the summary.

Net Leases: Includes all lease types whereby the tenant pays an agreed rent plus most, or all, of the operating expenses and taxes for the property, including utilities, insurance and/or maintenance expenses.

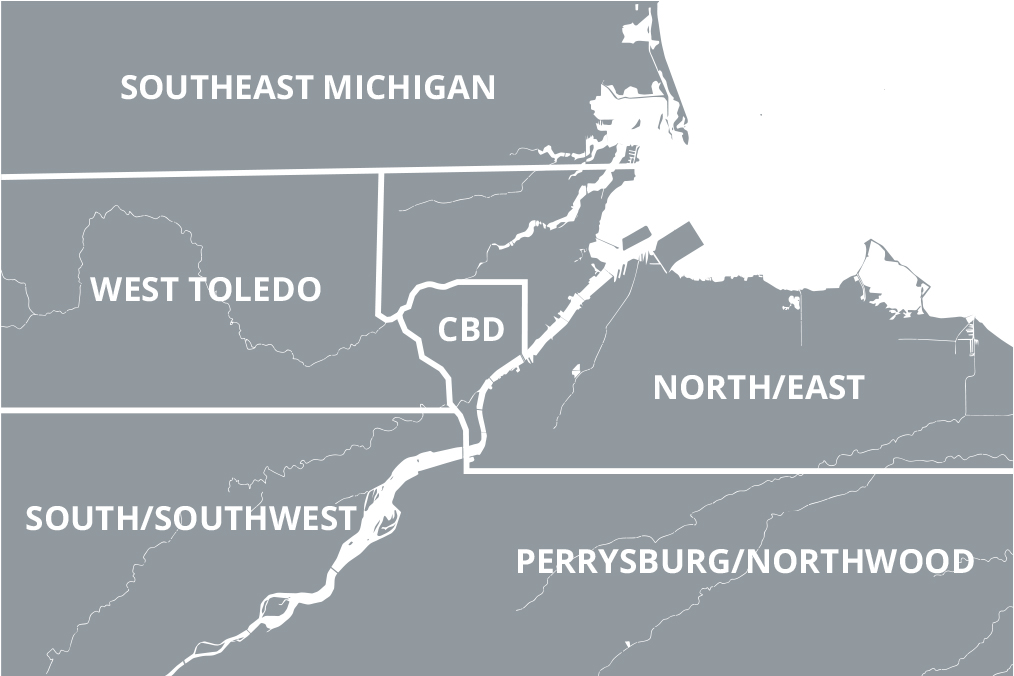
Market Coverage: Includes all competitive office buildings 5,000 square feet and greater in size.

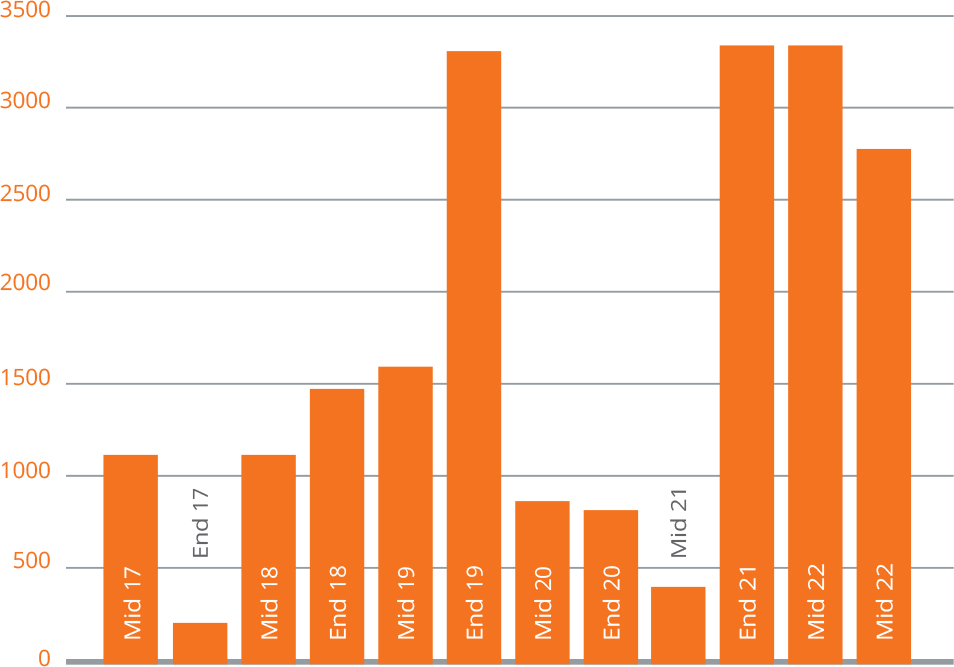
Net Absorption: The change in occupied square feet from one period to the next.

Net Rentable Area: The gross building square footage minus the elevator core, flues, pipe shafts, vertical ducts, balconies and stairwell areas.

Occupied Area (Square Feet): Building area not considered vacant.

Under Construction: Buildings which have begun construction as evidenced by site excavation or foundation work.

Available Area (Square Feet): Available Building Area which is either physically vacant or occupied.

Availability Rate: Available Square Feet divided by the Net Rentable

Vacant Area (Square Feet): Existing Building Area which is physically vacant or immediately available.

Vacancy Rate: Vacant Building Feet divided by the Net Rentable Area.

Normalization: Due to a reclassification of the market, the base, number and square footage of buildings of previous quarters have been adjusted to match the current base. Availability and Vacancy figures for those buildings have been adjusted in previ- ous quarters.

Interested in learning more?